
Little Helper -- An ESP32-based USB hardware display
contents
What is it? #
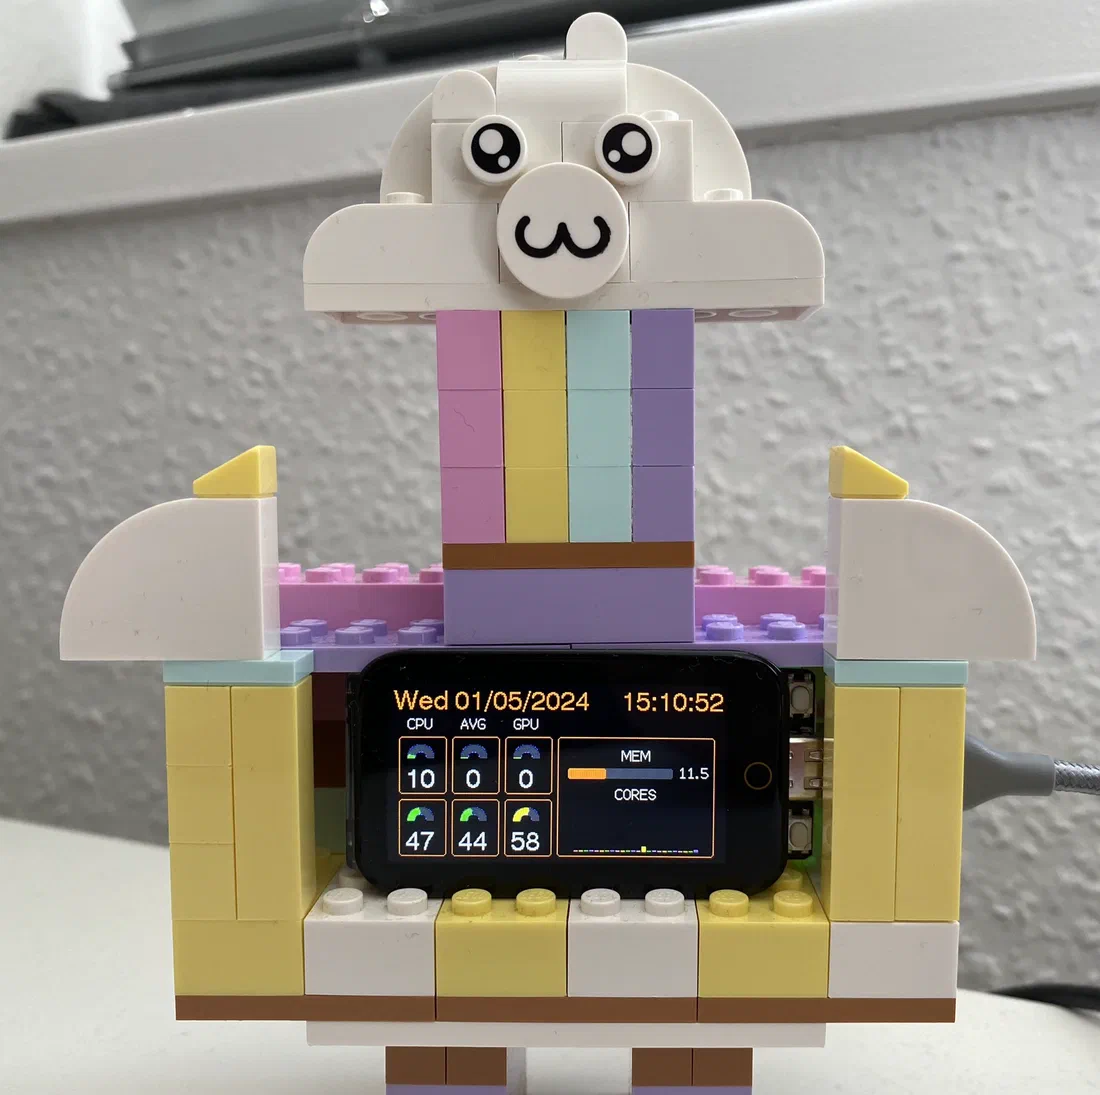
It’s a touch-enabled LCD screen that shows me hardware metrics from my main PC, mainly the ones related to utilization and temperature. Currently its features are:
- Per-core CPU Utilization
- CPU Temperature (Max, Avg)
- GPU Utilization and Temperature (NVIDIA only)
- RAM Usage
- VRAM Usage
- Notification bar
- Date & Time
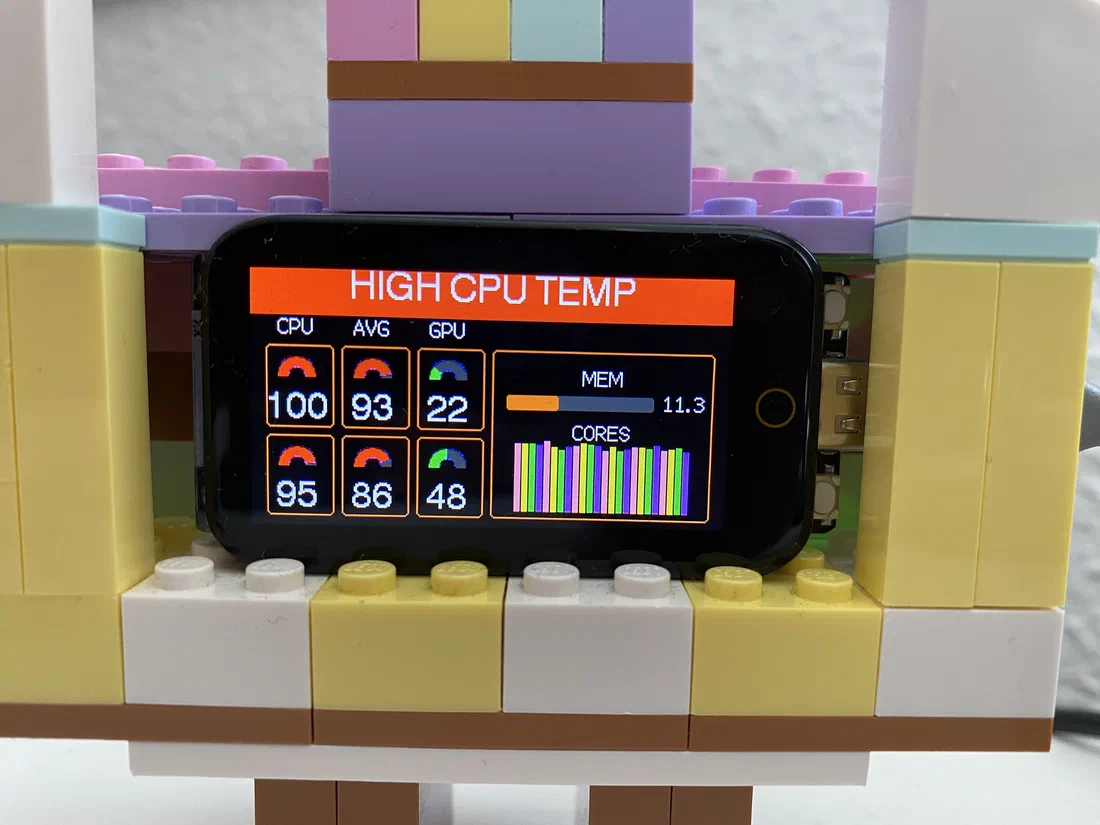
Top three gauges are utilization percentages, and the bottom three are temperature in Celsius. RAM and VRAM bars alternate every few seconds.
I find it pretty useful with a custom-built gaming PC, as it helps me tell what is being a bottleneck at a glance, and temperature information is good signal of something being wrong, or if the system will be throttling soon.
And hey, bars and gauges look cool.
How does it work? #
Here is the bill of materials:
So, the hardware is basically an ESP32-S3 with a touch display, and housed in a LEGO case because I wanted an excuse for building something with LEGOs. 
On the software side, there are two components:
- Little Helper: the ESP32-side software written using Arduino in C++, with PlatformIO for ease of deployment.
- Little Companion: Windows program written in Go.
The Go program collects hardware metrics, and sends it over USB to the ESP32, which then visualizes the information on its screen.
What else could be done? #
There are some more possibilities that come to my mind, but haven’t implemented them yet as I wanted to start out with something simpler. If you’re interested in building your own, here are some ideas straight from my TODO list:
- Display hanging/frozen apps, and one-touch kill them (sometimes can be useful on Windows)
- Display efficiency cores in a different color
- Disk I/O
- Network I/O
- Themes: wouldn’t it be cool to display information on a Pip-Boy?
- Display some pixel art animation, because why not!
Little Helper: the ESP32 code #
Little Helper is the name I gave to this project, and also the software that runs on ESP32. Since I didn’t know much about writing software for it, I simply copied some examples over from the MIT-licensed example repository for Lilygo and started building on top of it. Basically it’s Arduino and PlatformIO IDE to simplify deploying it.
Just like many other Arduino programs, it has a short setup() function to initialize itself and the display, and then runs the loop(). In my program it sleeps for around 100ms between refreshes, which is pretty frequent considering new data is received once a second.
Because it can’t keep time (or at least I couldn’t) while powered off, each time it comes up it asks for the time from the Companion, and receives a UNIX timestamp.
As for visualization, I’ve simply used the excellent TFT_eSPI library which had everything I needed: arcs, rectangles, text, colors and sprites.
Little Companion: the Go program on Windows #
The Companion consumes about 10MB of memory. Although I haven’t extensively benchmarked it, from the Task Manager its CPU use shows up as 0%.
Starting out I thought collecting metrics would be easy, and figuring out how to interface with the ESP32 would take some effort. It turned out to be opposite, thanks to the excellent cross-platform bugst/go-serial library sending data over USB was a breeze.
Collecting the metrics on the other hand took more effort:
- For CPU and Memory utilization, I could easily use gopsutil, it’s another excellent library, but doesn’t support most other metrics I wanted on Windows.
- CPU Temperature: this has been such a hassle, it has a section of its own as an appendix below.
- GPU Utilization/Temperature: handled it by loading
nvml.dlldynamically and calling its procedures. It took me some time to understand what I needed to do, but looking through thesys/windowspackage helped me out here. - VRAM: Fun fact, initially I didn’t even think of it. Then I noticed NVML returns both GPU and Memory utilization from
nvmlDeviceGetUtilizationRatescall, so I just made use of it.
I also implemented monitoring for hung windows, in the process I’ve learned what “Not Responding” actually means. This is what I do:
- Call
windows.EnumWindows()to get a list of all windows. - Call
IsWindowVisiblefromuser32.dllto check if it’s a visible window. I don’t care for invisible ones, sometimes they stop responding on their own and become false positives. - Call
IsHungAppWindowfromuser32.dllto check if the window is hung or not. - Finally, if hung, I call
GetWindowTextWandwindows.GetWindowThreadProcessId()to get the name of the window to display and the PID in case I’d like to terminate it.
It’s most likely a premature optimization to find another way, and this will most likely land on some idle E-core of my system anyway, but still it feels like a bit too much work to run on a loop every second. I haven’t found a better way of doing it though.
The protocol #
I made up a binary protocol between the two, in the current iteration it is something like this:
// Message received: 0x0, 0x1, 0x3, 0xFF
// Time request: 0x0, 0x3, 0xFF
// Time update: 0x0, 0x3, timestamp (4 bytes), 0xFF
// Metric update: 0x0, 0x2, flags, cpuCoreCount, cpuLoadPct (1 byte * core), avgCpuTemp, highestCpuTemp, gpuLoadPct, gpuTemp, gpuMemUtilPct, memUsedPct, memUsedMegabytes (2 bytes), 0xFF
And that’s all folks!
Appendix: Getting per-core CPU temperature on Windows #
I have to admit, I started out implementing the hardware monitors knowing next to nothing about how to get the information I wanted. The vague thoughts in my mind were somewhere around “I guess you’d read them from /proc or /sys on a Linux machine” and “It must be easy”. I was wrong.
As a challenge for this blog post, I gave myself five minutes of Googling time to find out how to get per-core temperature on my Intel NUC running Linux. One of the first results just worked:
/sys/devices/platform/coretemp.0/hwmon/hwmon3 $ grep -Ri "" temp*
temp2_crit:105000
temp2_crit_alarm:0
temp2_input:38000
temp2_label:Core 0
temp2_max:105000
[...]
Well that was easy. To be fair I was probably lucky with this one, maybe running the right CPU on the right distro with the right version of Linux kernel. Still, can you believe how easy this was?
Now let’s do this on Windows.
I won’t pretend to be a Windows developer, most development I’ve ever done on a Windows box is usually done through SSH to a Linux box. This very blog post? I’m writing on a self-hosted Visual Studio Code instance I have open on my browser. My Windows editor of choice is notepad.exe. 2
So I started out with some googling and ChatGPT-ing. After being misled bunch of times with both (don’t bother with WMI.), I changed course and instead went to read the code of some proper open source software and learn from my betters.
LibreHardwareMonitor is one of the most well-known hardware monitor software on Windows, and as the name implies it is open source. After a short jumping around I learned that they read it from MSR, or Model Specific Registers from the CPU. Now I won’t be easily disheartened by having to find whatever I need from hundreds of pages long documentations, I consider that fun. What was disheartening followed next:
- You can only
RDMSR(Read MSR) from Ring 0. - There seems to be no other interface that could relay the information I need on Windows.
- Except for an abandonware driver called
WinRing0, which has a very nasty looking CVE against it. - LibreHardwareMonitor still uses this very driver.
- Everyone is aware of its situation.
- But they can’t do much because Windows won’t let you load an unsigned driver, and getting it signed sounds like a huge ordeal. (and likely not possible for individuals at all).
Last time I checked, this issue was still open and seemed far from getting resolved: https://github.com/LibreHardwareMonitor/LibreHardwareMonitor/issues/984/.
I haven’t needed to dive any deeper than the one liner on Linux, but a quick googling tells me there are msr and msr_safe modules (does it mean msr is not safe? idk) and even a Go library seems to be available. What a luxury.
At this point, not wanting to disable any of the protections, and losing hope after reading the issue on LHM, I threw the towel.
Okay I still wanted to get CPU temperature data. I couldn’t completely throw the towel. Instead, I gave up on the idea of implementing everything in a single executable, and had to depend on another process: a well-known, but closed source tool called Core Temp offers a shared memory interface, and comes with its own, signed driver to read the data itself.
Once I walked the path of shame— I mean once I agreed to run another process in the background 3 and have their .dll loaded to my Go program, everything became much simpler. In fact there was already a Go library called coretempsdk-go and I practically needed nothing else.
As for Core Temp, it’s a small footprint, pretty nice program that has a daringly Web 1.0 website, and with its commercial version and being last updated on late 2023, gives me some hope that maybe it’s being maintained well. Am I happy with this arrangement? No. But I am content with it, which is all I could get out of Windows for today.
Initially I had a much nicer USB-C to USB-A 3.0 cable, for some reason I did not work correctly. Device would show up but I couldn’t open a serial connection to it. ↩︎
Joking. I have Visual Studio Code installed locally too. I rarely find a use for it though, except for projects such as this one. ↩︎
I was already using their software with a Logitech G13 for years before this project, so I just agreed to not uninstall it.
 ↩︎
↩︎